Exploring Python Libraries for Predictive Analytics: Data Visualization, Code, and Charts
- Computer Science

- Sep 25, 2024
- 3 min read
Welcome, students! Today, we delve into the fascinating world of predictive analytics, where data-driven insights and patterns are unveiled to shape the future. Specifically, we will unravel the power of Python libraries for predictive analytics, focusing on data visualization, essential code snippets, and the magic of charts and graphs.
Unveiling Python Libraries for Predictive Analytics
When it comes to predictive analytics, Python shines bright with a plethora of libraries that streamline the process of analyzing data, building models, and visualizing the outcomes. Let's explore some of the key libraries that can supercharge your predictive analytics projects:
Scikit-Learn
Scikit-Learn is a go-to library for machine learning in Python, offering a wide range of tools for predictive data analysis. With a user-friendly interface and extensive documentation, Scikit-Learn simplifies tasks like classification, regression, clustering, and more.
TensorFlow
TensorFlow is an open-source library primarily used for deep learning applications. This powerful library enables you to develop neural networks, train models, and make predictions with ease. From image recognition to natural language processing, TensorFlow has you covered.
Pandas
Pandas is a versatile data manipulation library that plays a crucial role in data preparation for predictive analytics. With Pandas, you can clean, transform, and analyze datasets effortlessly, making it an indispensable tool in your predictive analytics toolkit.
Data Visualization: Bringing Insights to Life
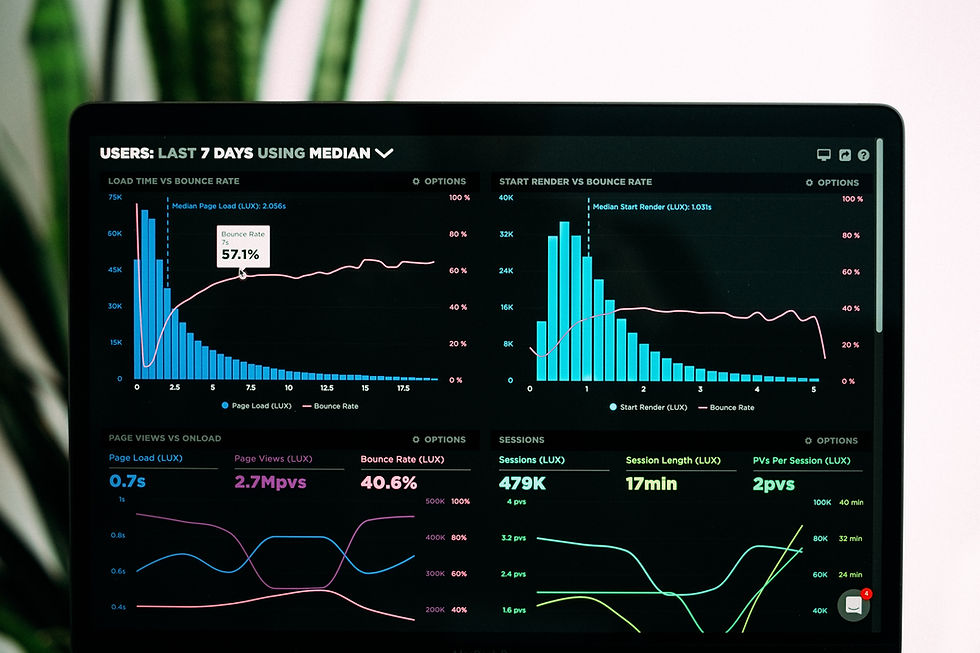
Data visualization is the art of representing data in visual formats such as charts, graphs, and dashboards to extract meaningful insights. Let's dive into some popular Python libraries and techniques for data visualization:
Matplotlib
Matplotlib is a robust plotting library that allows you to create a wide variety of charts, including line plots, bar charts, and histograms. Its flexibility and customization options make it a favorite among data scientists for showcasing data patterns effectively.
Seaborn
Seaborn is built on top of Matplotlib and offers a higher-level interface for creating attractive and informative statistical graphics. With Seaborn, you can generate visually appealing visualizations with minimal code, making it ideal for exploratory data analysis.
Demystifying Codes for Visualization
To give you a hands-on experience, let's explore some sample code snippets for data visualization using Matplotlib and Seaborn:
Embracing the Power of Visualizations
In the realm of predictive analytics, visualizations serve as a bridge between complex data and insightful interpretations. Whether you're uncovering trends, patterns, or anomalies, charts and graphs transform raw numbers into compelling narratives.
By mastering Python libraries like Matplotlib, Seaborn, and leveraging the capabilities of Scikit-Learn, TensorFlow, and Pandas, you are equipped to embark on data-driven journeys that unlock the predictive potential hidden within your datasets.
Start your predictive analytics exploration today and witness the transformative impact of data visualization and insightful code snippets in action!

Remember, the journey of predictive analytics begins with a single line of code and a vision to unravel the mysteries hidden within your data. Let Python libraries be your guide as you navigate the intricate landscape of data science and predictive modeling.
Unlock the power of predictive analytics with Python libraries, dive into the realm of data visualization, and let your insights shine bright in the world of data-driven decision-making.
Happy exploring, aspiring data scientists! Your predictive analytics adventure awaits, fueled by curiosity, code, and captivating visualizations.
In conclusion, may your predictions be accurate, your insights be illuminating, and your Python code be ever elegant as you embark on your predictive analytics odyssey.
In this blog post, we've delved into the enchanting world of predictive analytics, exploring Python libraries, data visualization techniques, and insightful code snippets for crafting captivating charts and graphs. Let the magic of data visualization and predictive analytics guide your journey towards data-driven discoveries and informed decisions.
Here are the answers to the assignment questions of Predictive Analytics:


Comments